Gold is down 20% from its highs... So what should we do? What's next for gold?
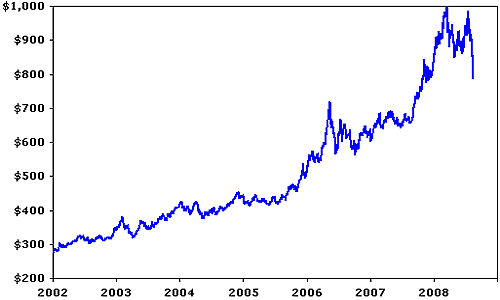
Gold peaked at around $1,000 an ounce in March of this year. Now it's around $800. Does that mean the bull market is over?
Before you write off gold... let's take a look at gold's last bull market – the decade of the 1970s – and compare it to today. First, let's look at today:
Gold Is Up 200% Since 2002

The chart looks great – and then it looks bad...
From January 2002 to earlier this year, gold soared from less than $300 an ounce to $1,000 an ounce – an incredible run. Even better, the run was remarkably pain free... with the exception of a fall of 20% or so in May 2006. Even though gold has recently given back $200, investors are up about 200% since the beginning of 2002.
Now let's consider the same time frame above (six years and eight months). Only this time, let's start from the beginning of 1970:
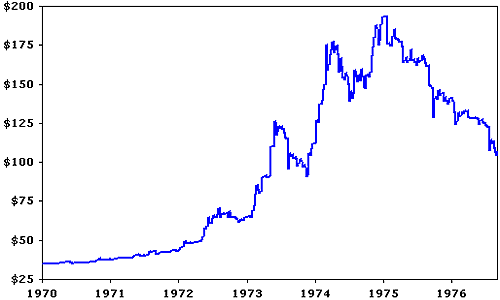
Gold Fell Nearly 50% in 1975-76

As you can see, gold soared from $35 to near $200 by 1975. But then, by the six-years-and-eight-months mark, gold had fallen to around $100 – nearly a 50% fall!
Looking at a chart like that, you might have thought the gold bull market was over. But if we extend that chart out for the rest of the 1970s... The 50% decline turned out to be just a blip:
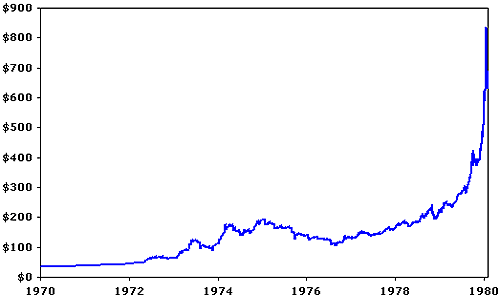
By 1980, Gold Had Soared Past $800

From 1970 to January of 1980, gold ran from $35 to $800. Despite its 50% fall in 1975-76.
Our friend John Doody – an economics professor turned editor of Gold Stock Analyst (GSA) – told his subscribers today a similar story yesterday:
The current "bear" market is simply a painful correction in Gold's ongoing bull market. What should happen is Gold resuming its gains versus all currencies. In GSA's opinion, the only uncertainty is "when."...GSA sees no change in the Dollar's fundamentals to end Gold's bull market.
Gold is priced in U.S. dollars. And the dollar has had its finest one-month run in a very long time... The Aussie dollar has lost over 10% of its value in a month versus the U.S. dollar. And other currencies, including the euro and the Swiss franc, lost nearly as much. (To see the carnage, check out the currency charts at the DailyWealth Market Window.)
Our friends at Seabridge Gold (SA) also have some strong comments on the gold market, in their just-released second-quarter report. As Seabridge sees it, the dollar's rise has combined with other market factors "to create a perfect storm for gold, a storm which should be relatively short lived, in our opinion." (Click here to read the rest of Seabridge's gold-market commentary.)
You can explain at least half of gold's fall by the nearly 10% rise in the dollar. And as John Doody and Seabridge explain, the rise of the dollar is probably a temporary phenomenon.
The Best Speculation in the World Right Now
Is This the End of the Gold Bull Market?
We have no guarantees that gold will resume its bull market now, or ever. But history shows gold has fallen as much as 50% before continuing a huge bull market. That helps put the recent 20% fall in perspective.
If history is any guide, over the course of the next five years, gold could fall farther than you think... and then soar higher than you can imagine.
Good investing,
Steve

No comments:
Post a Comment